Over the years chromatography has gained an enviable position in analytical laboratories involving separation and quantification of organic compound mixtures. However, a chromatogram is not a display of results in concentration units but rather a graphical display in real time of peaks generated as the separated components pass through the detector.
The chromatogram makes little sense to any layman as the peaks provide no information on the identity of the mixture components nor any knowledge on the amount present. That is why they aren’t able to learn much from the results.
If you want to master the art of interpreting a chromatogram, you first need to know exactly what a chromatogram is. But before moving on to that, let’s first take a look at chromatography, its advantages, types, and other details that will further help in the understanding of a chromatogram.
Chromatography
As stated earlier, chromatography is used in laboratories to separate or quantify the mixtures of organic compounds. For this purpose, it utilises the polarity difference in molecules, and the compounds get divided based on their affinity towards the stationary phase. There is also one mobile phase that is used to carry the mixture over the stationary phase.
This technique has been practised by experts ever since Mikhail Tswett found it in the year 1903. He only applied it to separate out different coloured pigments from plants with the support of a calcium carbonate column. However, chromatography proved effective for several components later on. It brought in different kinds of chromatography with time.
The primary reason why experts opt for this method is that it provides proper separation and analysis. Moreover, it can work for purification of components as well.
This technique works for a wide range of mixtures, including the too complicated ones. On top of everything, it doesn’t require high quantities of sample for the purpose. Therefore, the work gets done without putting in high volumes of the mixture.
Types of Chromatography
Before starting, you must know that different kinds of chromatography bring in different chromatographic analysis. That is why it is crucial to understand the major variations first. Based on the exact usage of the technique, chromatography can be divided into various types, such as: Liquid Chromatography: Here, organic solvents are the mobile phase, while silica and alumina solve the purpose of stationary phase.
Paper chromatography: The silica and alumina from the previous type get replaced with a paper soaked in liquid here. Plus, a liquid solvent is utilised in the place of the organic solvent. All the segregated particles can be observed as patches on the stationary phase after it dries out completely.
Column Chromatography: In this sort of chromatography, the stationary phase, as well as the mobile phases are kept inside a given column. The disassociation of the sample takes additional time here.
HPLC: This stands for High Performance/Pressure Liquid Chromatography. It is a more updated variant of the previous kind because high pressure is kept inside the column here to provide accelerated separation of the sample.
Thin Layer Chromatography: This is almost the same to paper chromatography, except for the different phases used here. Instead of soaked paper, this one utilises alumina or silica-coated sheet, which is made of glass or plastic. The absorbent’s spots can be seen on the sheet after the process completes.
A few more types of chromatography can be found in practice like gas and ion-exchange. In short, we can say that the techniques are almost the same in every kind, but their mobile and stationary phase differs.
What Is a Chromatogram?
Now that you have understood everything about chromatography, let’s learn about chromatography and chromatographic analysis.
Chromatogram definition can be understood simply by studying what a chromatogram depicts. The chromatogram is a two-dimensional plot with the ordinate axis giving concentration in terms of the detector response, and the abscissa represents the time. The detector gives a response as a peak whose height should be ideally dependent on the concentration of the particular component.
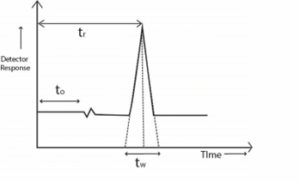 Retention Time (tr)
However, due to analysis conditions peaks may deviate from ideal shape and peak height can no longer be a true measure of the concentration and instead the area under the peak is considered as a measure of component concentration.
Each peak represents a component present in the sample. Retention time is time interval between sample injection and the maximum of the peak. It is characteristic of the identity of the component under the operating conditions. Identity of the component can be confirmed by making injections of reference material under the same operational conditions. The matching of retention time of reference material and the component peak confirms the identity of the unknown sample component.
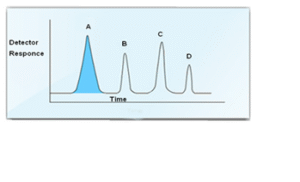
Now let us consider a sample which contains more than one sample component. Likewise each component will be eluted at different retention times depending upon solute – stationary phase interactions and mobile phase flow characteristics.
 Calculation of results
From the area measurements using simple arithmetic it is simple to calculate the concentration of each component as a percent of the total.
%A = [Latex]\frac{Area of Peak A X 100}{Total Areas of Peaks (A + B + C + D)}[/latex]
Real Chromatogram
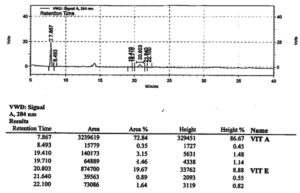
Let us now look at the actual chromatogram printout of HPLC separation of a mixture of vitamins A and E in a food matrix and see what the chromatogram represents
 Actual
Chromatogram
The ordinate is in units of volts and abscissa in minutes. The signals are recorded at a wavelength of 284 nm using a UV detector.
Retention time of each peak is marked above the peak and in the tabulated data below the chromatogram details of the retention time, area (as digital units), peak area%, height and height %. You can observe that due to non-ideal shape of peaks percentage area is different from percentage height for each component so area measurement is a more reliable measure of concentration.
You have been introduced to simple concepts on how to read a chromatogram. Please let us have your comments on the article and if you found it useful.

Posted by Opeyemi Akinbuli
Opeyemi@aasnig.com